Example - Clip Box
[1]:
import rioxarray # for the extension to load
import xarray

%matplotlib inline
Load in xarray dataset
[2]:
xds = xarray.open_dataarray("../../test/test_data/input/MODIS_ARRAY.nc")
[3]:
xds
[3]:
<xarray.DataArray (y: 200, x: 200)>
array([[ nan,  nan,  nan, ..., 656., 656., 554.],
       [ nan,  nan,  nan, ..., 694., 694., 642.],
       [ nan,  nan,  nan, ..., 456., 575., 642.],
       ...,
       [993., 817., 817., ..., 471., 479., 498.],
       [893., 893., 816., ..., 479., 479., 469.],
       [816., 816., 832., ..., 515., 469., 485.]], dtype=float32)
Coordinates:
  * y        (y) float64 5.05e+06 5.05e+06 5.05e+06 ... 5.004e+06 5.004e+06
  * x        (x) float64 -7.274e+06 -7.274e+06 ... -7.228e+06 -7.228e+06
Attributes:
    crs:        +a=6371007.181 +b=6371007.181 +lon_0=0 +no_defs +proj=sinu +u...
    res:        [231.65635826 231.65635826]
    is_tiled:   0
    nodata:     -28672.0
transform: [ 2.31656358e+02 0.00000000e+00 -7.27400965e+06 0.00000000e...[4]:
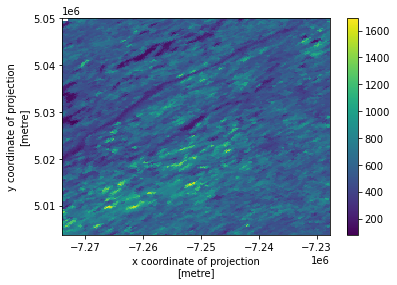
xds.plot()
[4]:
<matplotlib.collections.QuadMesh at 0x7f6aa6241360>
Clip using a bounding box
See docs for rio.clip_box:
[5]:
xdsc = xds.rio.clip_box(
    minx=-7272967.1958741,
    miny=5048602.84382404,
    maxx=-7272503.88315758,
    maxy=5049066.15654056,
)
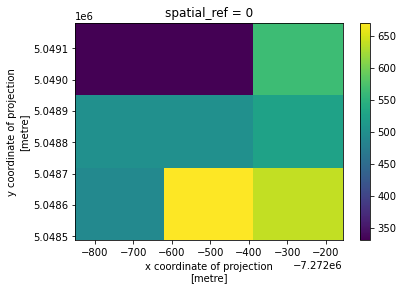
[6]:
xdsc.plot()
[6]:
<matplotlib.collections.QuadMesh at 0x7f6a9e1c64a0>
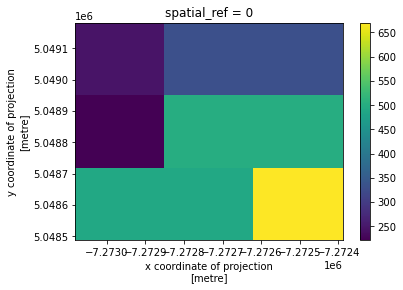
You can also clip using bounds in a CRS different from the dataset if you pass in the crs kwarg (requires rioxarray 0.12+):
[7]:
xdscn = xds.rio.clip_box(
    minx=-93.1558,
    miny=45.403,
    maxx=-93.1557,
    maxy=45.4065,
    crs="EPSG:4326",
)
[8]:
xdscn.plot()
[8]:
<matplotlib.collections.QuadMesh at 0x7f6a9c8815a0>