Example - Cloud Optimized GeoTiff (COG)
See docs for rioxarray.open_rasterio
[1]:
import rioxarray

%matplotlib inline
[2]:
# from https://openaerialmap.org/
cog_url = (
    "https://oin-hotosm.s3.amazonaws.com/"
    "5d7dad0becaf880008a9bc88/0/5d7dad0becaf880008a9bc89.tif"
)
[3]:
rds = rioxarray.open_rasterio(cog_url, masked=True, overview_level=4)
[4]:
rds
[4]:
<xarray.DataArray (band: 3, y: 312, x: 688)>
[643968 values with dtype=float64]
Coordinates:
  * band         (band) int64 1 2 3
  * y            (y) float64 4.34e+06 4.34e+06 4.34e+06 ... 4.339e+06 4.339e+06
  * x            (x) float64 -1.333e+07 -1.333e+07 ... -1.333e+07 -1.333e+07
    spatial_ref  int64 0
Attributes:
    transform:     (1.194328566955879, 0.0, -13334019.180693429, 0.0, -1.1943...
    scales:        (1.0, 1.0, 1.0)
    offsets:       (0.0, 0.0, 0.0)
    grid_mapping:  spatial_ref
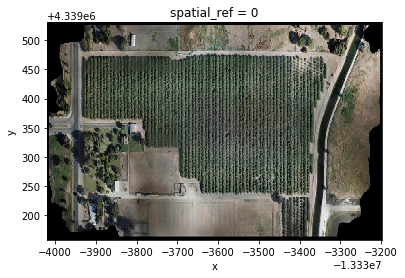
[5]:
rds.astype("int").plot.imshow(rgb="band")
Clipping input data to the valid range for imshow with RGB data ([0..1] for floats or [0..255] for integers).
[5]:
<matplotlib.image.AxesImage at 0x7fa30cc3aeb8>