Example - Filling in missing data & dealing with timestamps
[1]:
import geopandas

from geocube.api.core import make_geocube

%matplotlib inline
Load in geopackage data and add CRS
[2]:
gdf = geopandas.read_file(
    "../../test/test_data/input/time_vector_data.geojson",
    crs="epsg:4326",
)
[3]:
gdf.head()
[3]:
| test_attr | test_str_attr | test_time_attr | geometry | |
|---|---|---|---|---|
| 0 | 1.3 | dcf86619 | 5/21/2016 10:09:21 AM -05:00 | POINT (-47.26681 44.21932) |
| 1 | 1.3 | dcf86619 | 5/21/2016 10:09:21 AM -05:00 | POINT (-47.26680 44.21932) |
| 2 | 1.9 | dcf86619 | 5/21/2016 10:09:21 AM -05:00 | POINT (-47.26681 44.21932) |
| 3 | 1.3 | dcf86619 | 5/21/2016 10:09:21 AM -05:00 | POINT (-47.26680 44.21932) |
| 4 | 1.3 | dcf86619 | 5/21/2016 10:09:21 AM -05:00 | POINT (-47.26679 44.21932) |
[4]:
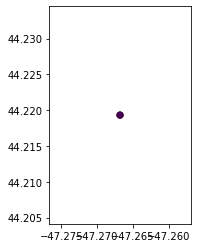
gdf.head().plot(column='test_attr')
[4]:
<matplotlib.axes._subplots.AxesSubplot at 0x7f2f1cd18240>

Convert to raster with GeoCube
See docs for make_geocube
Load into grid basic
[5]:
geo_grid = make_geocube(
    vector_data=gdf,
    measurements=['test_attr', "test_time_attr"],
    datetime_measurements=["test_time_attr"],
    resolution=(-0.1, 0.00001),
    group_by="test_time_attr",
)
/home/snowal/miniconda/envs/geocube/lib/python3.6/site-packages/xarray/core/variable.py:151: FutureWarning: Converting timezone-aware DatetimeArray to timezone-naive ndarray with 'datetime64[ns]' dtype. In the future, this will return an ndarray with 'object' dtype where each element is a 'pandas.Timestamp' with the correct 'tz'.
        To accept the future behavior, pass 'dtype=object'.
        To keep the old behavior, pass 'dtype="datetime64[ns]"'.
  return np.asarray(pd.Series(values.ravel())).reshape(values.shape)
[6]:
geo_grid
[6]:
<xarray.Dataset>
Dimensions:         (test_time_attr: 2, x: 12, y: 11)
Coordinates:
  * y               (y) float64 45.25 45.15 45.05 44.95 ... 44.45 44.35 44.25
  * x               (x) float64 -47.27 -47.27 -47.27 ... -47.27 -47.27 -47.27
  * test_time_attr  (test_time_attr) datetime64[ns] 2016-05-21T15:09:21 2016-05-22T15:09:22
    spatial_ref     int64 0
Data variables:
    test_attr       (test_time_attr, y, x) float64 nan nan nan ... nan nan nan
Attributes:
    grid_mapping:  spatial_ref
[7]:
# mask nodata and plot
grid_time_1 = geo_grid.isel(test_time_attr=0)
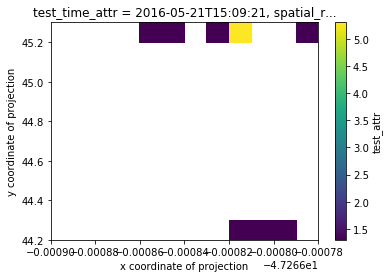
grid_time_1.test_attr.where(grid_time_1.test_attr!=grid_time_1.test_attr.rio.nodata).plot()
[7]:
<matplotlib.collections.QuadMesh at 0x7f2f19274128>

Load into UTM grid followed by interpolation for missing values
See docs for make_geocube
[8]:
geo_grid_interp = make_geocube(
    vector_data=gdf,
    measurements=['test_attr', "test_time_attr"],
    datetime_measurements=["test_time_attr"],
    resolution=(-0.1, 0.00001),
    group_by="test_time_attr",
    interpolate_na_method='nearest'
)
/home/snowal/miniconda/envs/geocube/lib/python3.6/site-packages/xarray/core/variable.py:151: FutureWarning: Converting timezone-aware DatetimeArray to timezone-naive ndarray with 'datetime64[ns]' dtype. In the future, this will return an ndarray with 'object' dtype where each element is a 'pandas.Timestamp' with the correct 'tz'.
        To accept the future behavior, pass 'dtype=object'.
        To keep the old behavior, pass 'dtype="datetime64[ns]"'.
  return np.asarray(pd.Series(values.ravel())).reshape(values.shape)
[9]:
geo_grid_interp
[9]:
<xarray.Dataset>
Dimensions:         (test_time_attr: 2, x: 12, y: 11)
Coordinates:
  * y               (y) float64 45.25 45.15 45.05 44.95 ... 44.45 44.35 44.25
  * x               (x) float64 -47.27 -47.27 -47.27 ... -47.27 -47.27 -47.27
  * test_time_attr  (test_time_attr) datetime64[ns] 2016-05-21T15:09:21 2016-05-22T15:09:22
    spatial_ref     int64 0
Data variables:
    test_attr       (test_time_attr, y, x) float64 1.3 1.3 1.3 ... 1.3 1.3 1.3
Attributes:
    grid_mapping:   spatial_ref
    creation_date:  2019-12-12 19:57:17.046150
[10]:
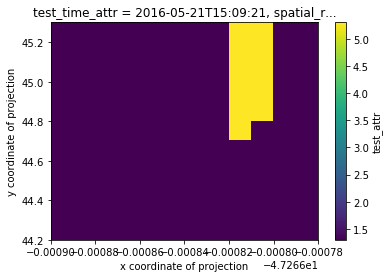
geo_grid_interp.test_attr.isel(test_time_attr=0).plot()
[10]:
<matplotlib.collections.QuadMesh at 0x7f2f191bc0f0>
